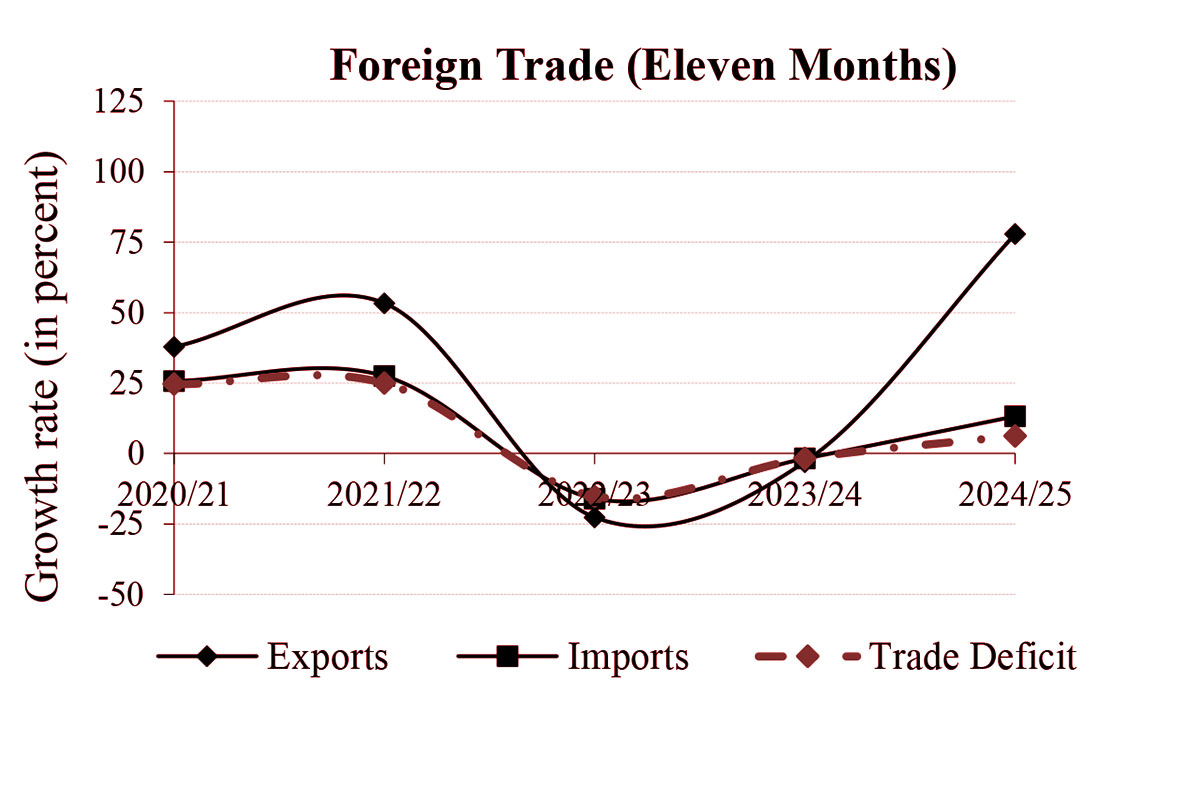
Merchandise exports surge by 77.8 pc, imports by 13.1 pc in 11 months


KATHMANDU: Merchandise exports rose 77.8% to Rs 247.57 billion in the first 11 months of the current fiscal year 2024/25, compared with 3.0% decline a year earlier, the latest macro-economic and financial situation report released by Nepal Rastra Bank (NRB) today shows.
By destination, exports to India climbed 112.6%, to China by 3.0% and to other countries by 4.4%.
Exports of soybean oil, polyester yarn and thread, jute goods, tea and rosin increased, while those of palm oil, zinc sheet, juice, ready-made garments and cardamom fell over the review period.
Merchandise imports grew 13.1% to Rs 1,644.80 billion in the same period, after a 1.8% decline in the previous year, NRB data show.
By destination, imports from India rose 7.6%, from China by 15.3% and from other countries by 29.5%.
Imports of crude soybean oil, rice and paddy, transport equipment, vehicles and spare parts, edible oil and sponge iron increased, whereas imports of petroleum products, gold, electrical equipment, chemical fertiliser and coal declined.
Customs-point data show exports from Bhairahawa, Biratnagar, Birgunj, Dry Port, Kailali, Krishnanagar, Mechi, Nepalgunj, Rasuwa and Tribhuvan Airport all rose, while exports at other major points fell. On the import side, arrivals through Jaleshwor and Tribhuvan Airport fell, but increased at all other principal customs posts.
The trade deficit widened by 6.3% to Rs 1,397.23 billion in the 11 months to mid-April 2025, after narrowing by 1.7% in the same period of 2023/24. The export-to-import ratio improved to 15.1% from 9.6%.
During the period, imports from India paid in convertible foreign currency amounted to Rs 167.30 billion, up from Rs 137.13 billion a year earlier.
Composition of foreign trade
According to the Broad Economic Categories (BEC), final consumption, intermediate and capital goods accounted for 67.3%, 31.7% and 1.0% of total exports, respectively, in the review period. In the same period of the previous year, the shares were 42.8%, 56.5% and 0.62%.
On the import side, final consumption, intermediate and capital goods represented 39.4%, 51.6% and 9.1% of total imports in the review period, compared with 41.9%, 48.7% and 9.4% a year earlier.
Export-Import Price Index
The year-on-year unit-value export price index, based on customs data, fell by 2.8%, while the import price index declined by 1.9% in the first 11 months of 2024/25. The terms of trade index decreased by 0.9% in the review period.
Services
Net services income remained in deficit at Rs 97.33 billion in the review period, compared with a deficit of Rs 56.36 billion a year earlier. Under the services account, travel income rose by 6.9% to Rs 82.2 billion, from Rs 76.88 billion in the same period of the previous year. Travel payments increased by 16.5% to Rs 203.97 billion, including Rs 124.8 billion for education, up from Rs 175.16 billion and Rs 117.01 billion respectively a year earlier.


-1785736377.jpeg)